
REAL-WORLD ILLUSTRATIONS
See Your Guaranteed
Income Potential
Real-world annuity illustrations help you understand how income, protection, riders, and contract values may work before you make a decision.
Clarity Before You
Commit
Annuity illustrations are not estimates or sales hype. They are objective, math-based roadmaps designed to show exactly how a specific strategy may perform based on your unique profile and goals.
These comprehensive documents provide a clear breakdown of how your age, premium amount, selected index strategy, and contract terms interact to shape your guaranteed lifetime income and accumulation potential. We believe you should understand every detail before making a decision.

What Every Illustration Reveals
Starting Premium
Issue Age
Income Start Age
Guaranteed Lifetime Income
Accumulation Value
Rider Details
Surrender Period
Carrier Information
Illustration Gallery
Real Numbers In Action
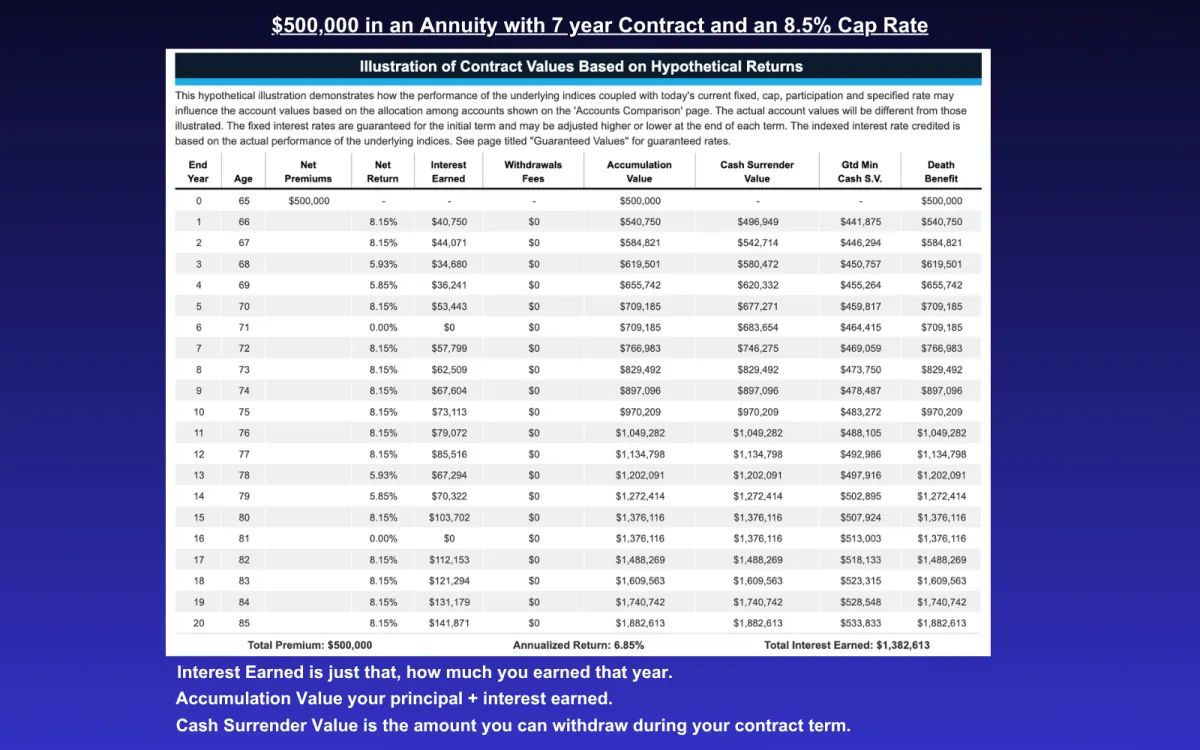
This illustration is a $500,000 annuity premium allocated to the S&P 500 strategy with an 8.5% annual cap over 7 years. If the S&P gains more than 8.5%, your account is credited 8.5%. If the index gains less, you receive exactly that. If the market is negative, you receive 0%—never a loss. Each year's gains are locked in and can never be taken away by future market declines.
This illustration assumes a $500,000 annuity premium allocated to the S&P 500 strategy with a 65% participation rate over 10 years. You receive 65% of the index gain each year, with gains locked in annually and never lost. For example, if the S&P gains 20%, your account is credited 13%. If the market is negative, your account earns 0% and your principal is protected.
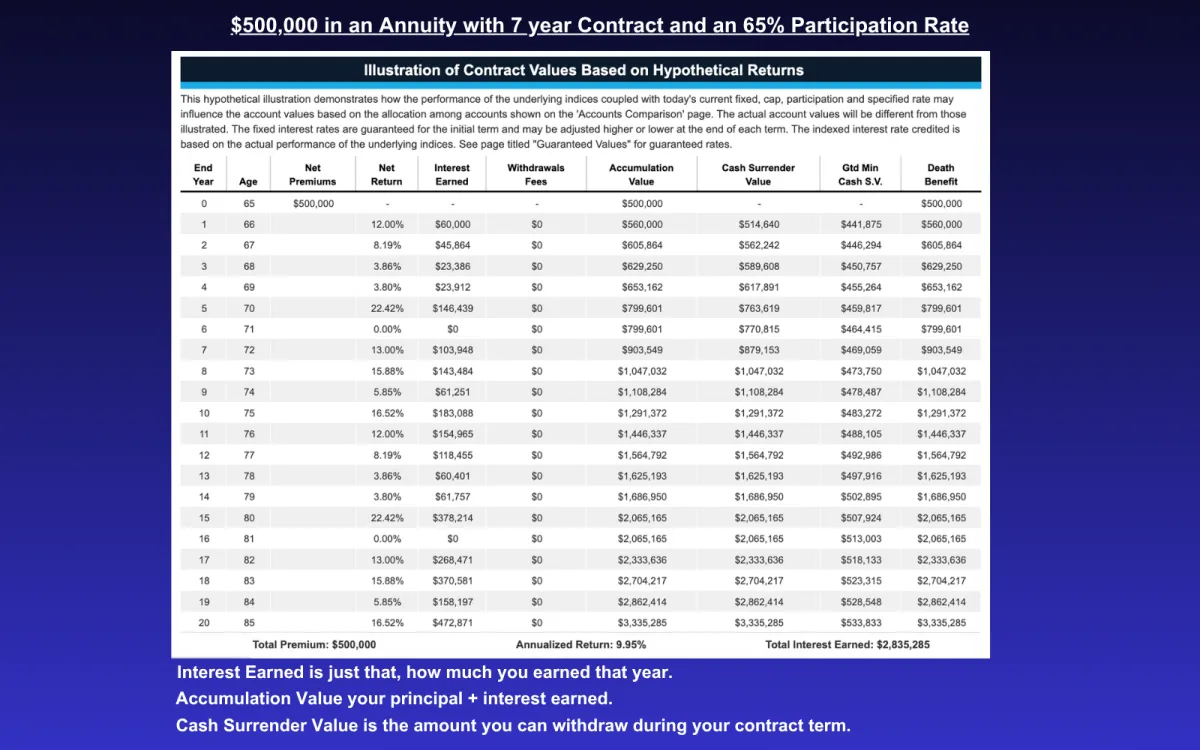
These illustrations show how your money can grow over time with market-linked gains, and protection from market losses.
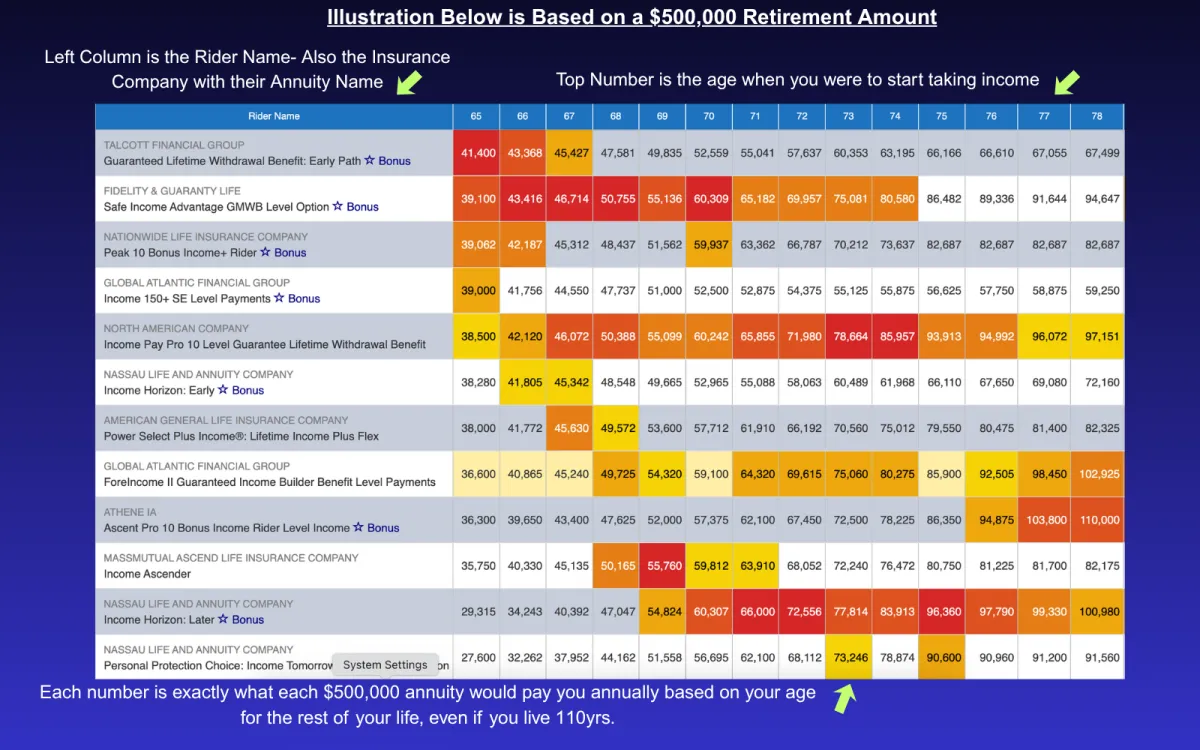
These Guaranteed Lifetime Income illustrations show how your money can pay you out each year even if you live to be 110 years old.
End Year
The contract year being shown (Year 1 through Year 20).
Age
Your age during that specific contract year.
Net Premiums
The total amount you have contributed into the annuity.
Net Return
The credited interest rate for that year based on the index performance, subject to the 8% cap.
Interest Earned
The dollar amount of interest credited to your account for that year.
Withdrawals / Fees
Any withdrawals or fees taken from the account (none shown in this example).
Accumulation Value
Your total account value, including all credited interest.
This is your main “growing balance.
Cash Surrender Value
The amount available if you fully surrender the contract in that year, after any surrender charges.
Min Cash Surrender Value
The minimum value the insurance company guarantees, regardless of market performance. Used when MVA's lower surrender.
Death Benefit
The amount paid to your beneficiary if you pass away in that year.
TAKE THE NEXT STEP
Get Your Personal Blueprint
We can run a personalized illustration based on your age, goals, savings amount, and income needs.
No obligation • No Pressure
Check out our Annuity Games under All Things Annuities. And Educate yourself at Annuity University.
Copyright © 2026 Annuity Gal LLC. All rights reserved.


